Small caps and the Santa Claus rally: What the data shows
As the year draws to a close, investors traditionally turn their attention to the so-called "Santa Claus rally," a period that covers the last five trading days of December and the first two of January, when equities have historically tended to rise. The key question is whether investors can count on this seasonal effect and which segments of the market have delivered the most consistent results. For Oninvest, analyst Aldiyar Anuarbekov has looked at how small-cap ETFs have behaved during this window over the last 15 years and compared those patterns with the performance of individual stocks from the Russell 2000.
Small-cap ETF performance
To assess the seasonal effect, Anuarbekov analyzed Invesco S&P SmallCap 600 ETFs, which track the performance of firms from a wide array of sectors, like tech, energy, industrials, consumer discretionary, defense, health care, financials, utilities, and telecommunications.
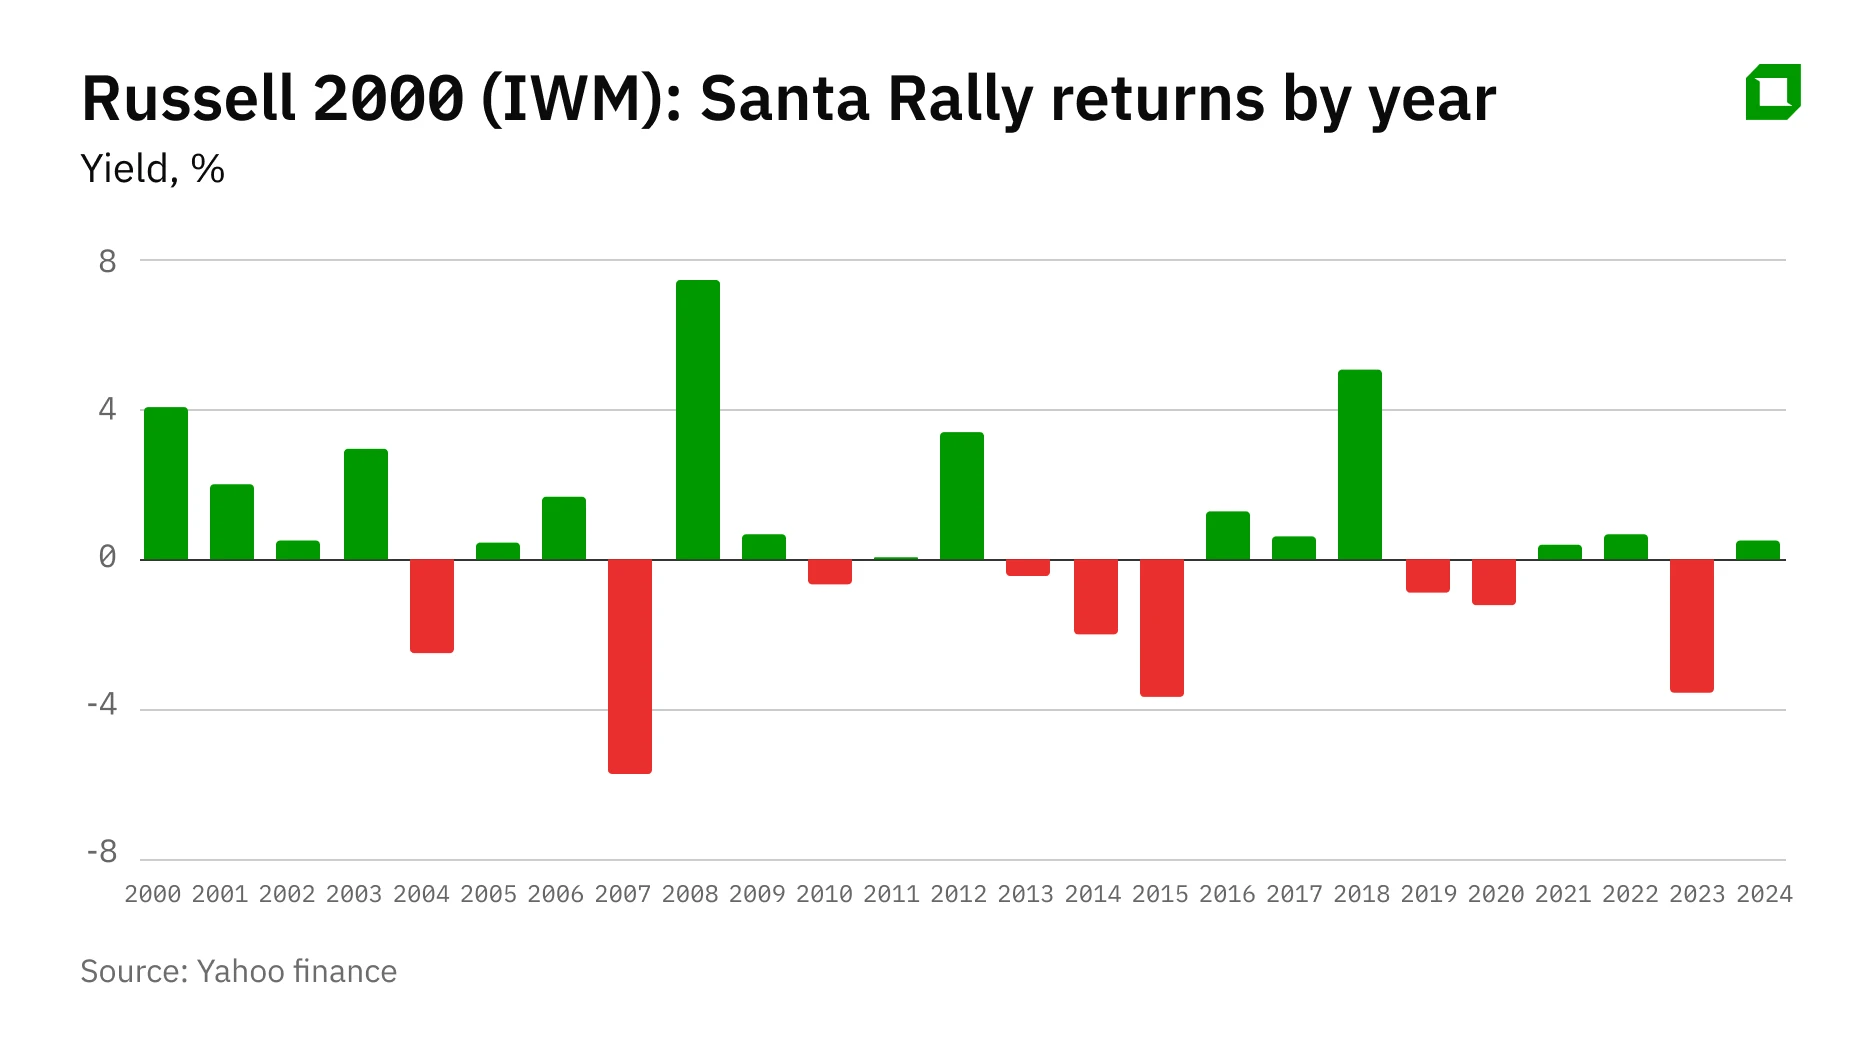
The data shows that the Santa Claus rally is not a stable or uniform phenomenon for small caps. An equal weight portfolio of small-cap ETFs ended the seven-day holiday window with gains in 53.3% of cases, or eight out of 15 years. At the same time, performance varied widely across sectors. The most consistent results were recorded in the energy sector, where the Energy ETF posted positive returns in 60% of observations. Overall performance too varied widely: in 2018, the small-cap funds rose 12.4% over the seven trading days, while in 2015 they fell 7.1%.
Industrials was the second-most stable sector. It finished the holiday period in positive territory in 53.3% of cases, though peak gains were noticeably more modest. The strongest result was about 4.15% in 2018, while drawdowns in weaker years were of comparable magnitude. Consumer discretionary, health care, information technology, and utilities and communication services showed positive dynamics in 46.7% of observations, meaning fewer than half of the years studied. Financials and real estate proved even less consistent, ending the period in the black only 40% of the time.
Consumer staples was the weakest-performing sector. Over the past 15 years, it closed the holiday window higher in just 33.3% of cases. It tends to show smoother December dynamics, while short-term dynamics right at the end of the year are often weak or negative.
Russell 2000 performance
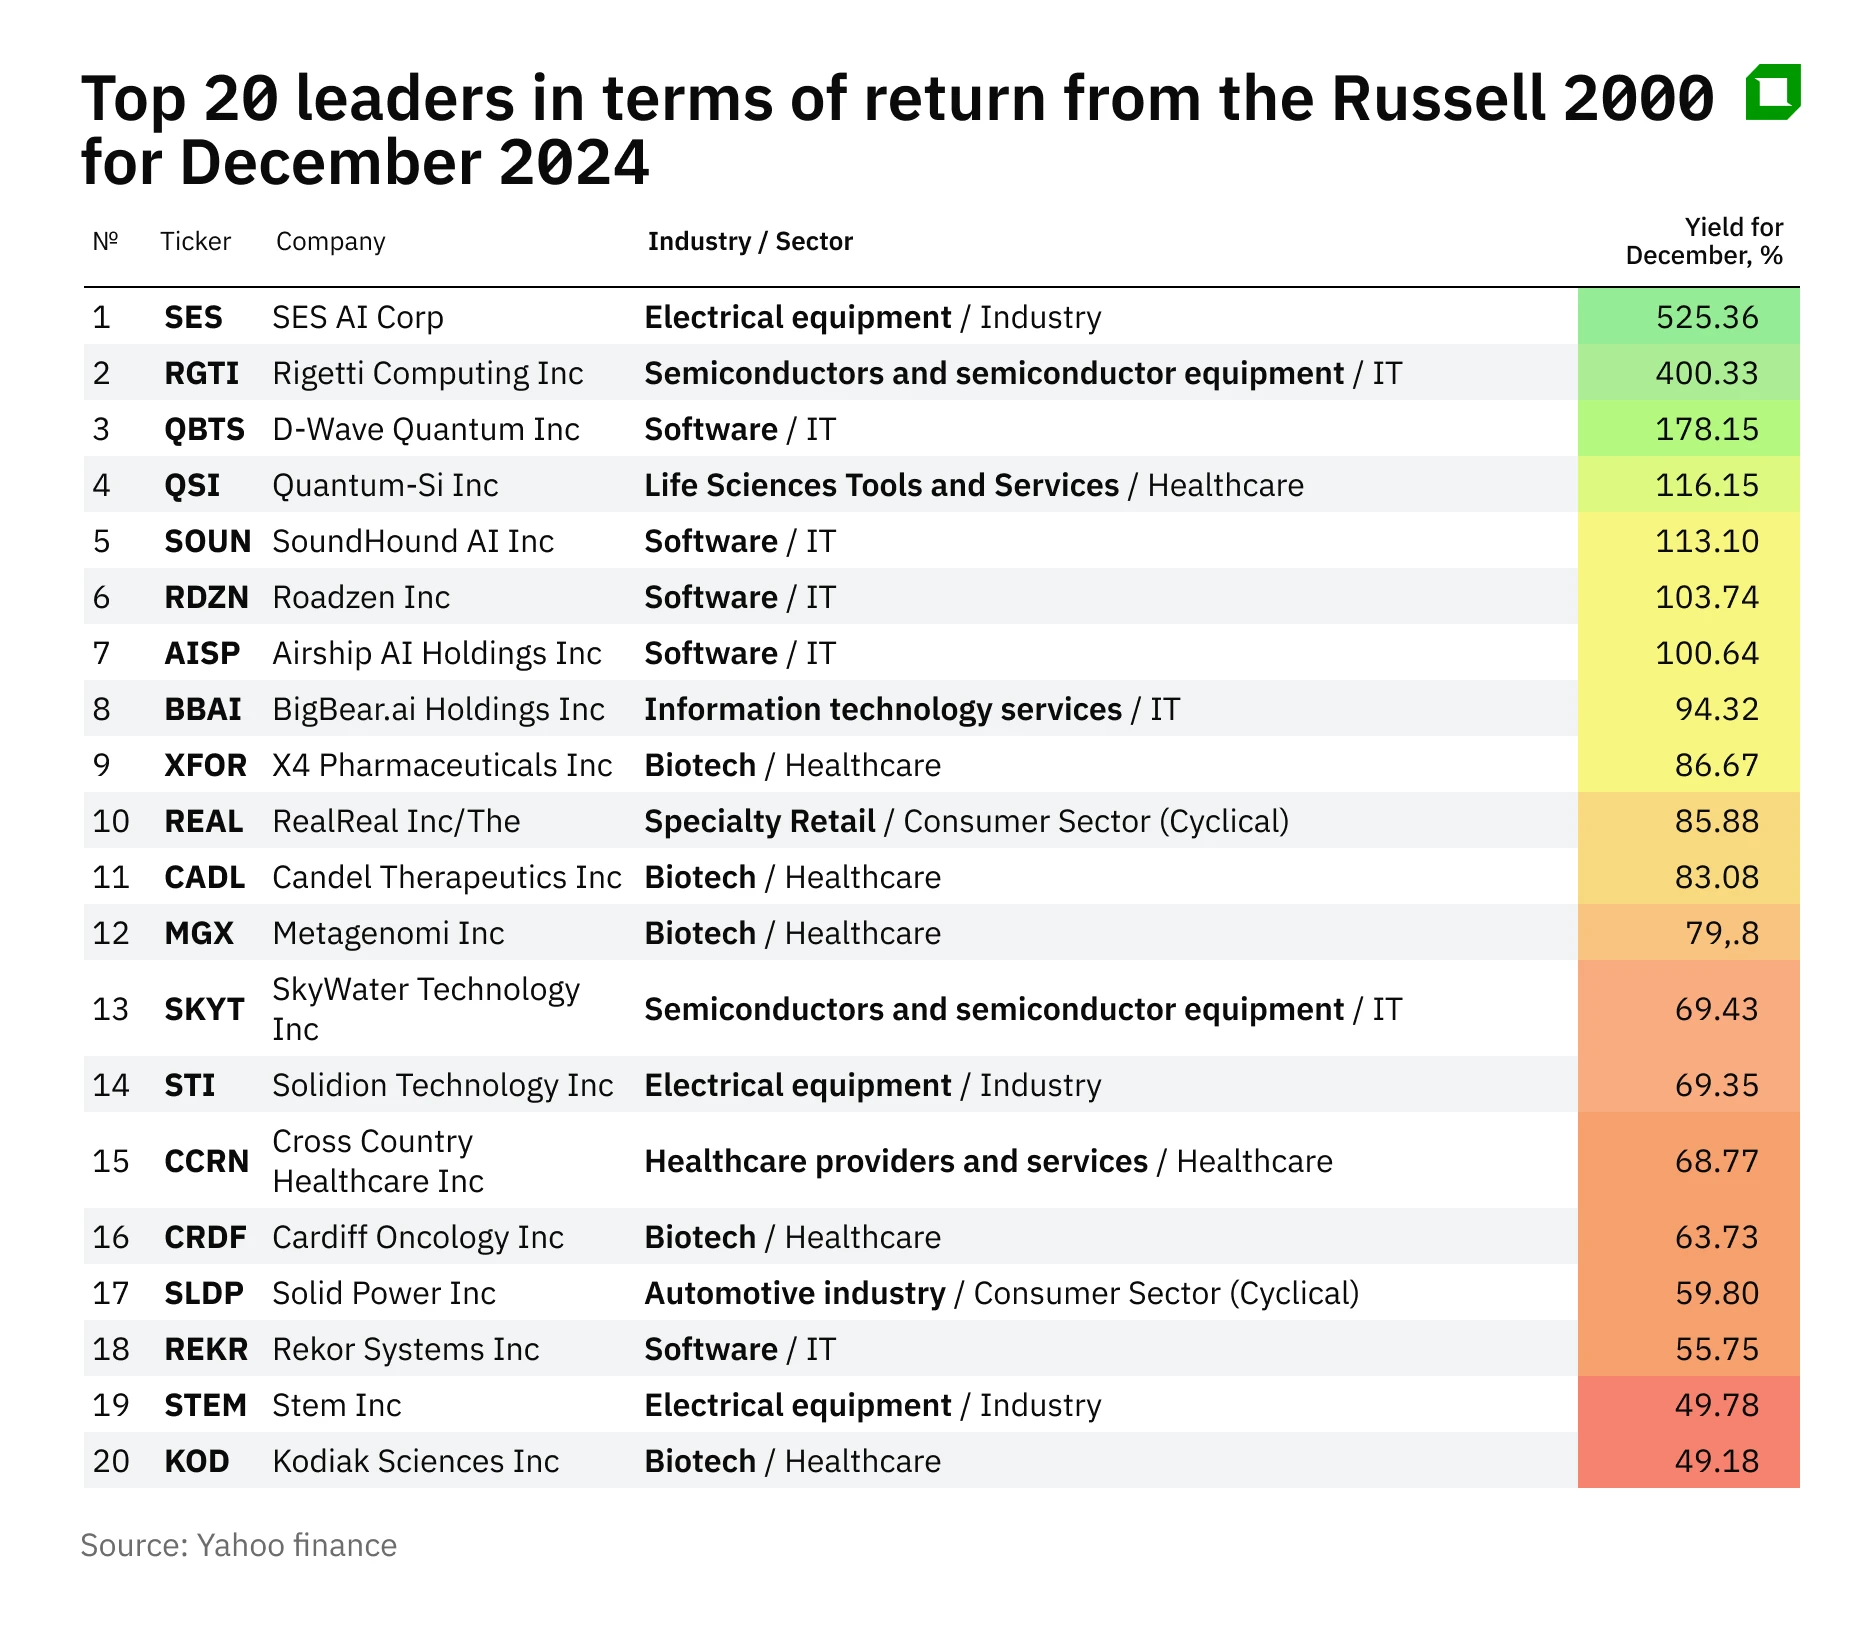
In parallel, Anuarbekov analyzed December’s strongest individual performers within the Russell 2000 to identify which industries and business models were behind the sharpest one-month moves.
Five years of data show that the largest price spikes tend to recur in the same industries. Health care, primarily biotechnology and pharmaceuticals, consistently dominated the top of the rankings. In several years, December gains of 100-200% were recorded, with isolated cases reaching 400-500%.Energy and oil and gas companies regularly took second place. Some names in this group also doubled or tripled in value within a single month.
The third cluster consisted of information technology companies, including software developers, semiconductor producers, and niche IT services providers. These stocks frequently appeared among December’s leaders, with returns in the 80-150% range, particularly in 2020-2021. By contrast, consumer discretionary and industrial companies were significantly less likely to feature among the top performers. Defensive sectors, like consumer staples, utilities, and real estate, were almost entirely absent from the list of December leaders.
At the individual stock level, sharp December gains are typically tied to specific news catalysts rather than seasonality alone. In December 2024, shares of SES AI surged after the company reported progress in lithium-metal battery development. SoundHound AI jumped following a rating upgrade to “outperform” and a doubling of its target price by Wedbush, alongside an agreement with Nvidia. Candel Therapeutics rallied sharply after announcing a large public offering arranged by Citi, BofA, and Canaccord, which the market interpreted as a signal of institutional interest. Taken together, this suggests that while the list of Russell 2000 December leaders changes from year to year, the sources of extreme moves have remained largely the same. Over the past five years, they have been concentrated in high-risk segments, primarily AI, quantum technologies, software, and biotech.
External research broadly supports these findings. Jeffrey Hirsch, editor-in-chief of the Stock Trader’s Almanac, links the behavior of the Russell 2000 to classical seasonal patterns. In his assessment, small caps often begin to strengthen even before the January effect officially starts, with a meaningful share of excess returns forming in the second half of December, when tax-loss selling fades and buyer demand returns.
Conclusions for investors
Analyst Zain Vawda made a similar point in a MarketPulse article, arguing that the Santa Claus rally reflects shifts in liquidity and capital rotation rather than abstract holiday optimism. In his view, small-cap stocks are particularly sensitive to changes in interest rate expectations and early-year portfolio rebalancing.
Hirsch and Vawda both link year-end strength in small caps to broader seasonal and liquidity-driven patterns, noting that gains formed during the Santa Claus rally window have historically coincided with continued relative outperformance of small-cap stocks in January.
Taken together, sector ETF data, analysis of extreme December moves within the Russell 2000, and external seasonality research paint a fairly complete picture. The Santa Claus rally is not a guaranteed source of returns in the small-cap space, but a period marked by elevated volatility and uneven risk premia, where sector selection and tolerance for drawdowns play the decisive role.
For long-term investors, this seasonal pattern is better viewed as a supplementary tool for timing their entry into the small-cap segment rather than as a stand-alone investment approach.
This material does not constitute individualized investment advice.