Small-cap ETF 1H performance: Energy, value 1Q focus gives way to broad gains in 2Q


In 1H26, ETFs tracking the S&P SmallCap 600, which includes only profitable companies, had outperformed peers tracking the Russell 2000 / Photo: Shutterstock.com
The first half of the year ended with a convincing victory for U.S. small caps. The Russell 2000 gained 21%, significantly outperforming the Russell Midcap, up 13%; the Russell 1000, up 8%; and the S&P 500, up 9.3%. By contrast, Germany’s DAX added 2% over the same period, while Hong Kong’s Hang Seng fell 10.7%.
While gains in the first quarter were driven mainly by a small group of value stocks, particularly in the energy sector, the rally broadened to encompass virtually the entire small-cap market in the second quarter.
One reason was the de-escalation of the conflict in the Middle East. Oil prices began to fall after the U.S. and Iran signed a ceasefire memorandum. BofA strategists forecast, in a note seen by Oninvest, that Brent would average $70-80 per barrel in the second half, versus around $90 per barrel in the first. Against this backdrop, small-cap fundamentals continue to improve: the consensus earnings forecast for Russell 2000 companies has risen 13% since the beginning of the year thanks to a recovery in industrial activity, BofA noted.
1H26 small-cap ETF leaders
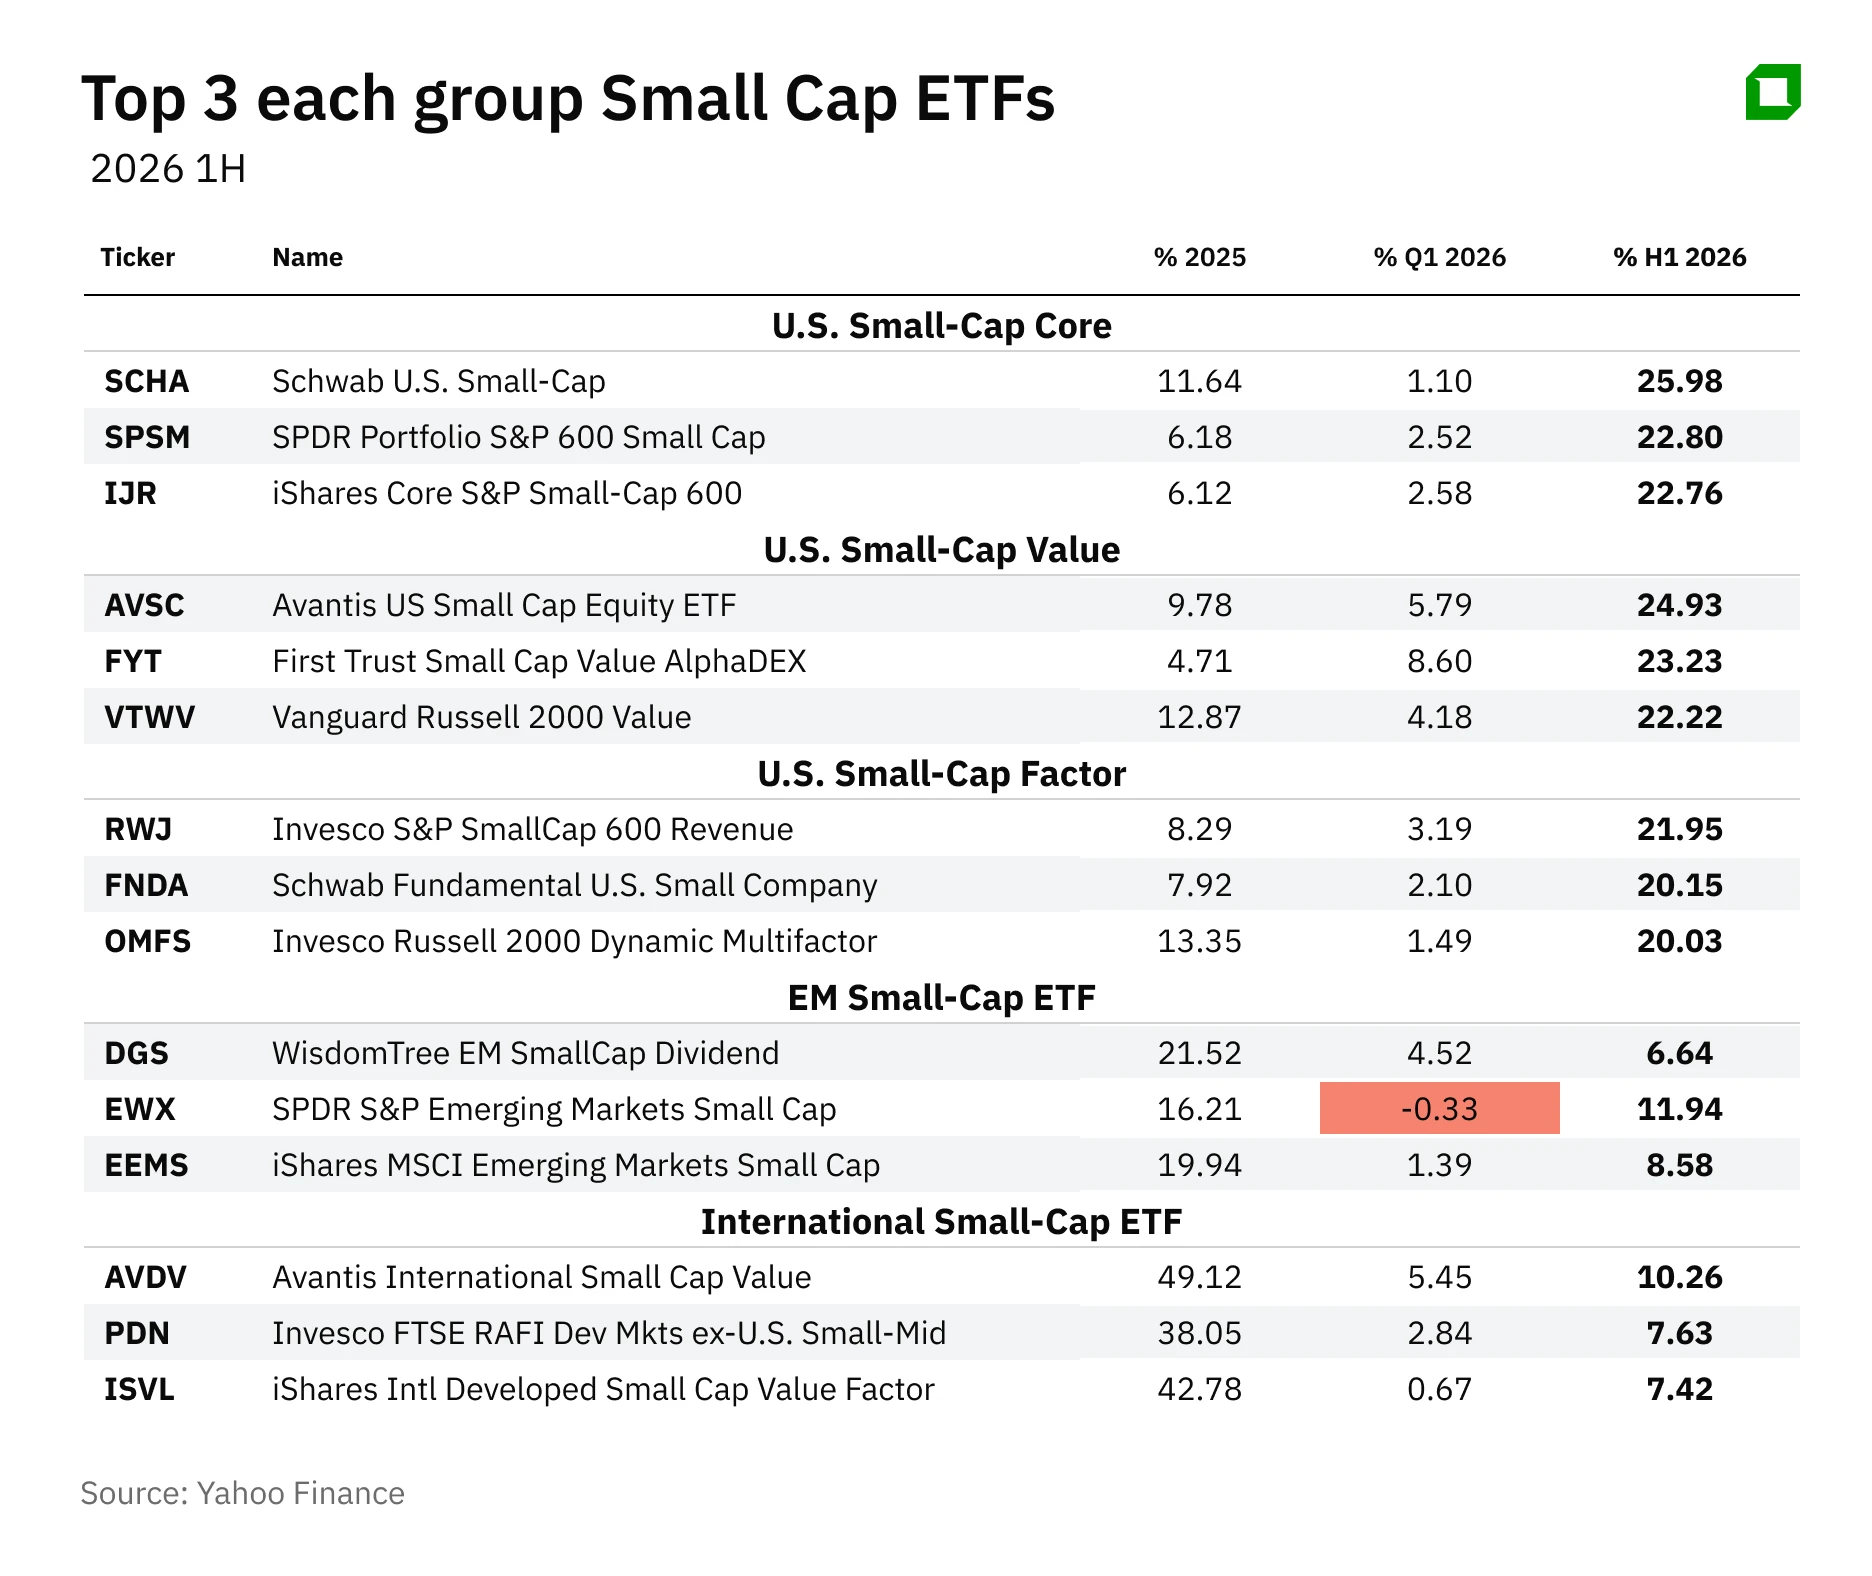
Among the 38 small-cap ETFs reviewed by Oninvest, the Schwab U.S. Small-Cap ETF delivered the highest return in the first half, gaining 25.98%. The fund tracks the Dow Jones U.S. Small-Cap Total Stock Market Index, which comprises companies ranked 751 through 2,500 by market capitalization. As a result, its portfolio includes not only mature companies but also smaller, fast-growing issuers absent from the S&P SmallCap 600. Another advantage was one of the lowest expense ratios in the segment: Schwab cut it to 0.03% on June 11.
The Avantis U.S. Small Cap Equity ETF placed second with a return of 24.93%. It is an actively managed fund that invests in around 1,500 companies. When selecting stocks, it considers their valuations, profitability, and investment levels.
The First Trust Small Cap Value AlphaDEX ETF ranked third, gaining 23.23%. The fund invests in small-cap value stocks from the Nasdaq U.S. 700 Small Cap Index. Despite falling oil prices in the second quarter, its performance was supported by substantial exposure to the financial and industrial sectors.
Notably, ETFs tracking the S&P SmallCap 600, which includes only profitable companies, outperformed funds tracking the Russell 2000. The State Street SPDR Portfolio S&P 600 Small Cap ETF, iShares Core S&P Small-Cap ETF, and Vanguard S&P Small-Cap 600 ETF gained 22.7-22.8%, while the iShares Russell 2000 ETF and Vanguard Russell 2000 ETF rose 21.3-21.4%.
Meanwhile, value funds stopped outperforming the market: the Avantis U.S. Small Cap Value ETF gained 21.74%, while the Vanguard Russell 2000 Value ETF added 22.22%, virtually matching the performance of the broad indexes.
EMs outperform DMs
Developed-market small-cap funds lagged their U.S. counterparts by a wide margin. The Avantis International Small Cap Value ETF posted the best result, gaining 10.26% in the first half, while the other funds in this group rose just 5-7.6%. By contrast, the MSCI ACWI ex U.S. Index gained 13% over the same period.
Emerging-market funds performed better. The WisdomTree Emerging Markets SmallCap Dividend Fund led with a return of 14.03%. It was followed by the SPDR S&P Emerging Markets Small Cap ETF, up 12.86%; the iShares MSCI Emerging Markets Small Cap ETF, up 11.93%; and the Avantis Emerging Markets Small Cap Equity ETF, up 10.42%. The funds’ performance contrasted sharply with the Hang Seng, which fell 10.7% in the first half.
The scale of the segment’s gains was also confirmed by the June Russell index reconstitution, which shifted to a semiannual schedule for the first time since the 1980s. The newly constituted indexes took effect after the market closed on June 26. In the year through the April 30 rank day, the Russell 2000 gained 44.4%, versus 30.4% for the Russell 1000. At the same time, the breakpoint separating large caps from small caps rose 24% to a market capitalization of $5.7 billion. This means that a company whose market capitalization would have been sufficient for inclusion in the Russell 1000 a year ago could now fall within the Russell 2000.
Biggest contributors to best-performing ETFs
Schwab U.S. Small-Cap ETF
The Schwab U.S. Small-Cap ETF owed much of its strong return to a single stock. Its largest holding, with an unusually high weight of around 6.6%, was Sandisk, a NAND flash-memory manufacturer spun off from Western Digital in February 2025. The company had a market capitalization of around $5.6 billion when it was added to the index. Over the following year, however, its shares gained so much that its market capitalization exceeded $260 billion, lifting it out of the small-cap category. Nevertheless, the fund continues to hold the stock because the Dow Jones U.S. Small-Cap Index is reconstituted once a year, in September, while quarterly rebalancings do not provide for the removal of companies whose share prices have risen too sharply.
Sandisk shares skyrocketed around 780% in the first half amid strong demand for memory used in data centers supporting AI systems. In the third quarter of its fiscal 2026, the company’s revenue rose 251% year over year to $5.95 billion, while data-center sales increased 645%.
Following the earnings release, Bernstein raised its target price for Sandisk to $3,000 per share, almost twice its current market share price. BofA and Citigroup maintained target prices of $2,500 per share. However, such a high concentration in a single stock increases risk for the Schwab ETF.
Avantis U.S. Small Cap Equity ETF
As of July 9, the largest holding in the Avantis U.S. Small Cap Equity ETF, with a weight of around 0.59%, was MYR Group, a contractor specializing in the construction and modernization of power grids that has emerged as one of the beneficiaries of the data-center boom. By mid-July, Materion, a manufacturer of specialty materials for the electronics, aerospace, and defense industries, had become the portfolio’s largest holding. The change reflects the fact that the Avantis U.S. Small Cap Equity ETF is actively managed, allowing the fund managers to adjust portfolio weights and holdings quickly without waiting for a scheduled rebalancing.
In the first quarter of this year, MYR Group increased revenue to $1 billion, up $166.8 million year over year, while also reporting record net income of $46.8 million and a record order book of $2.84 billion. MYR Group shares have gained more than 230% since the beginning of the year. Meanwhile, Oppenheimer analysts initiated coverage of the stock in June with a neutral “perform” rating, noting that its current valuation already appeared high versus peers.
First Trust Small Cap Value AlphaDEX ETF
The largest holdings in the First Trust Small Cap Value AlphaDEX ETF changed markedly following the oil rally. As of July 5, the fund’s largest holding, with a weight of 1.02%, was GEO Group, an operator of migrant detention centers and the second-largest private-prison company in the U.S., which works under contracts with U.S. Immigration and Customs Enforcement.
In the first quarter, GEO Group reported a 17% year-over-year increase in revenue to $705.2 million and a 96% rise in earnings to $0.29 per share. The company raised its full-year outlook and said contracts secured in 2025 could add up to $520 million in annual revenue.
The change in the portfolio’s largest holding – from oil producer Kosmos Energy in the first quarter to GEO Group – shows how quickly shifts in the geopolitical environment can reshuffle the leaders within the value segment.

Outlook
The sustained de-escalation scenario underpinning investment firms’ June forecasts proved premature. The U.S. and Iran resumed exchanging strikes in July, Washington revoked its authorization for Iranian oil sales, and Trump said the ceasefire was over. Against this backdrop, Brent rose back to around $80 per barrel. This has revived the scenario that prevailed in the first quarter: rising oil prices could support value funds with high exposure to energy companies.
The second risk facing small caps in the second half is a potential reversal in Fed policy. BofA analysts expect three 25-basis-point rate hikes in September, October, and December. The bank estimates that each increase could reduce Russell 2000 companies’ operating profit by around 2%, as more than 40% of their debt has short-term or floating interest rates.
BofA prefers mid caps versus small caps in the second half and recommends focusing on quality within the segment while avoiding the most heavily indebted companies. Investors have already begun reducing risk: U.S. small-cap equity funds recorded $9.2 billion in outflows in the week through June 24, while U.S. equity funds overall posted outflows for the first time in 13 weeks, according to BofA data from a note seen by Oninvest.
The main argument in favor of small caps remains intact: according to UBS, they are trading below historical valuations, while large-cap peers remain substantially more expensive. Meanwhile, the FactSet consensus forecast calls for earnings growth among S&P SmallCap 600 companies to accelerate to 36% year over year in the fourth quarter.
The main question for investors in the second half is whether earnings growth can offset potential pressure from interest rates and continued geopolitical instability in the Middle East.
This text is for informational purposes only and does not constitute personalized investment advice.