The small-cap rally has come to a halt. Which ETFs have managed to stay in positive territory?
In the Oninvest sample, funds focused on IT and energy, as well as funds that select companies based on free cash flow, posted the best results

As of the end of the first nine months of 2026, energy and technology small-cap ETFs are leading the pack / Photo: Shutterstock.com
Through the first nine months of 2026, U.S. small-cap companies maintained a slight edge over large-cap companies. The Russell 2000 Index rose 13.7% during this period, compared with 12.3% for the Russell 1000, which tracks large U.S. companies. However, nearly all of this lead was gained in the first half of the year: in the third quarter, the Russell 2000 lost 7.2%, while the Russell 1000 gained 1.8%.
The turnaround coincided with a tightening of monetary policy: On September 16, the Fed raised rates by 25 basis points for the first time since 2023, to 3.75–4%. According to Russell Investments, the yield on 10-year Treasury bonds rose by 0.85 percentage points over the quarter, to 5.29%, reaching its highest level since 2002. Oil prices rose above $100 per barrel again. For small-cap companies with a high proportion of floating-rate debt, this combination is particularly painful.
To evaluate the performance of small-cap ETFs over the past nine months, Oninvest expanded its sample from 38 to 108 funds, adding sector ETFs tracking the S&P SmallCap 600, funds focused on small commodity companies, and country-specific ETFs. Since the beginning of the year, 103 out of 108 funds have risen, while only 25 posted positive returns in the third quarter. The average return for the funds over the nine-month period was 12.8%, while for the third quarter it was -5.7%*.
Nine-Month Leaders: Technology, Energy, and Free Cash Flow
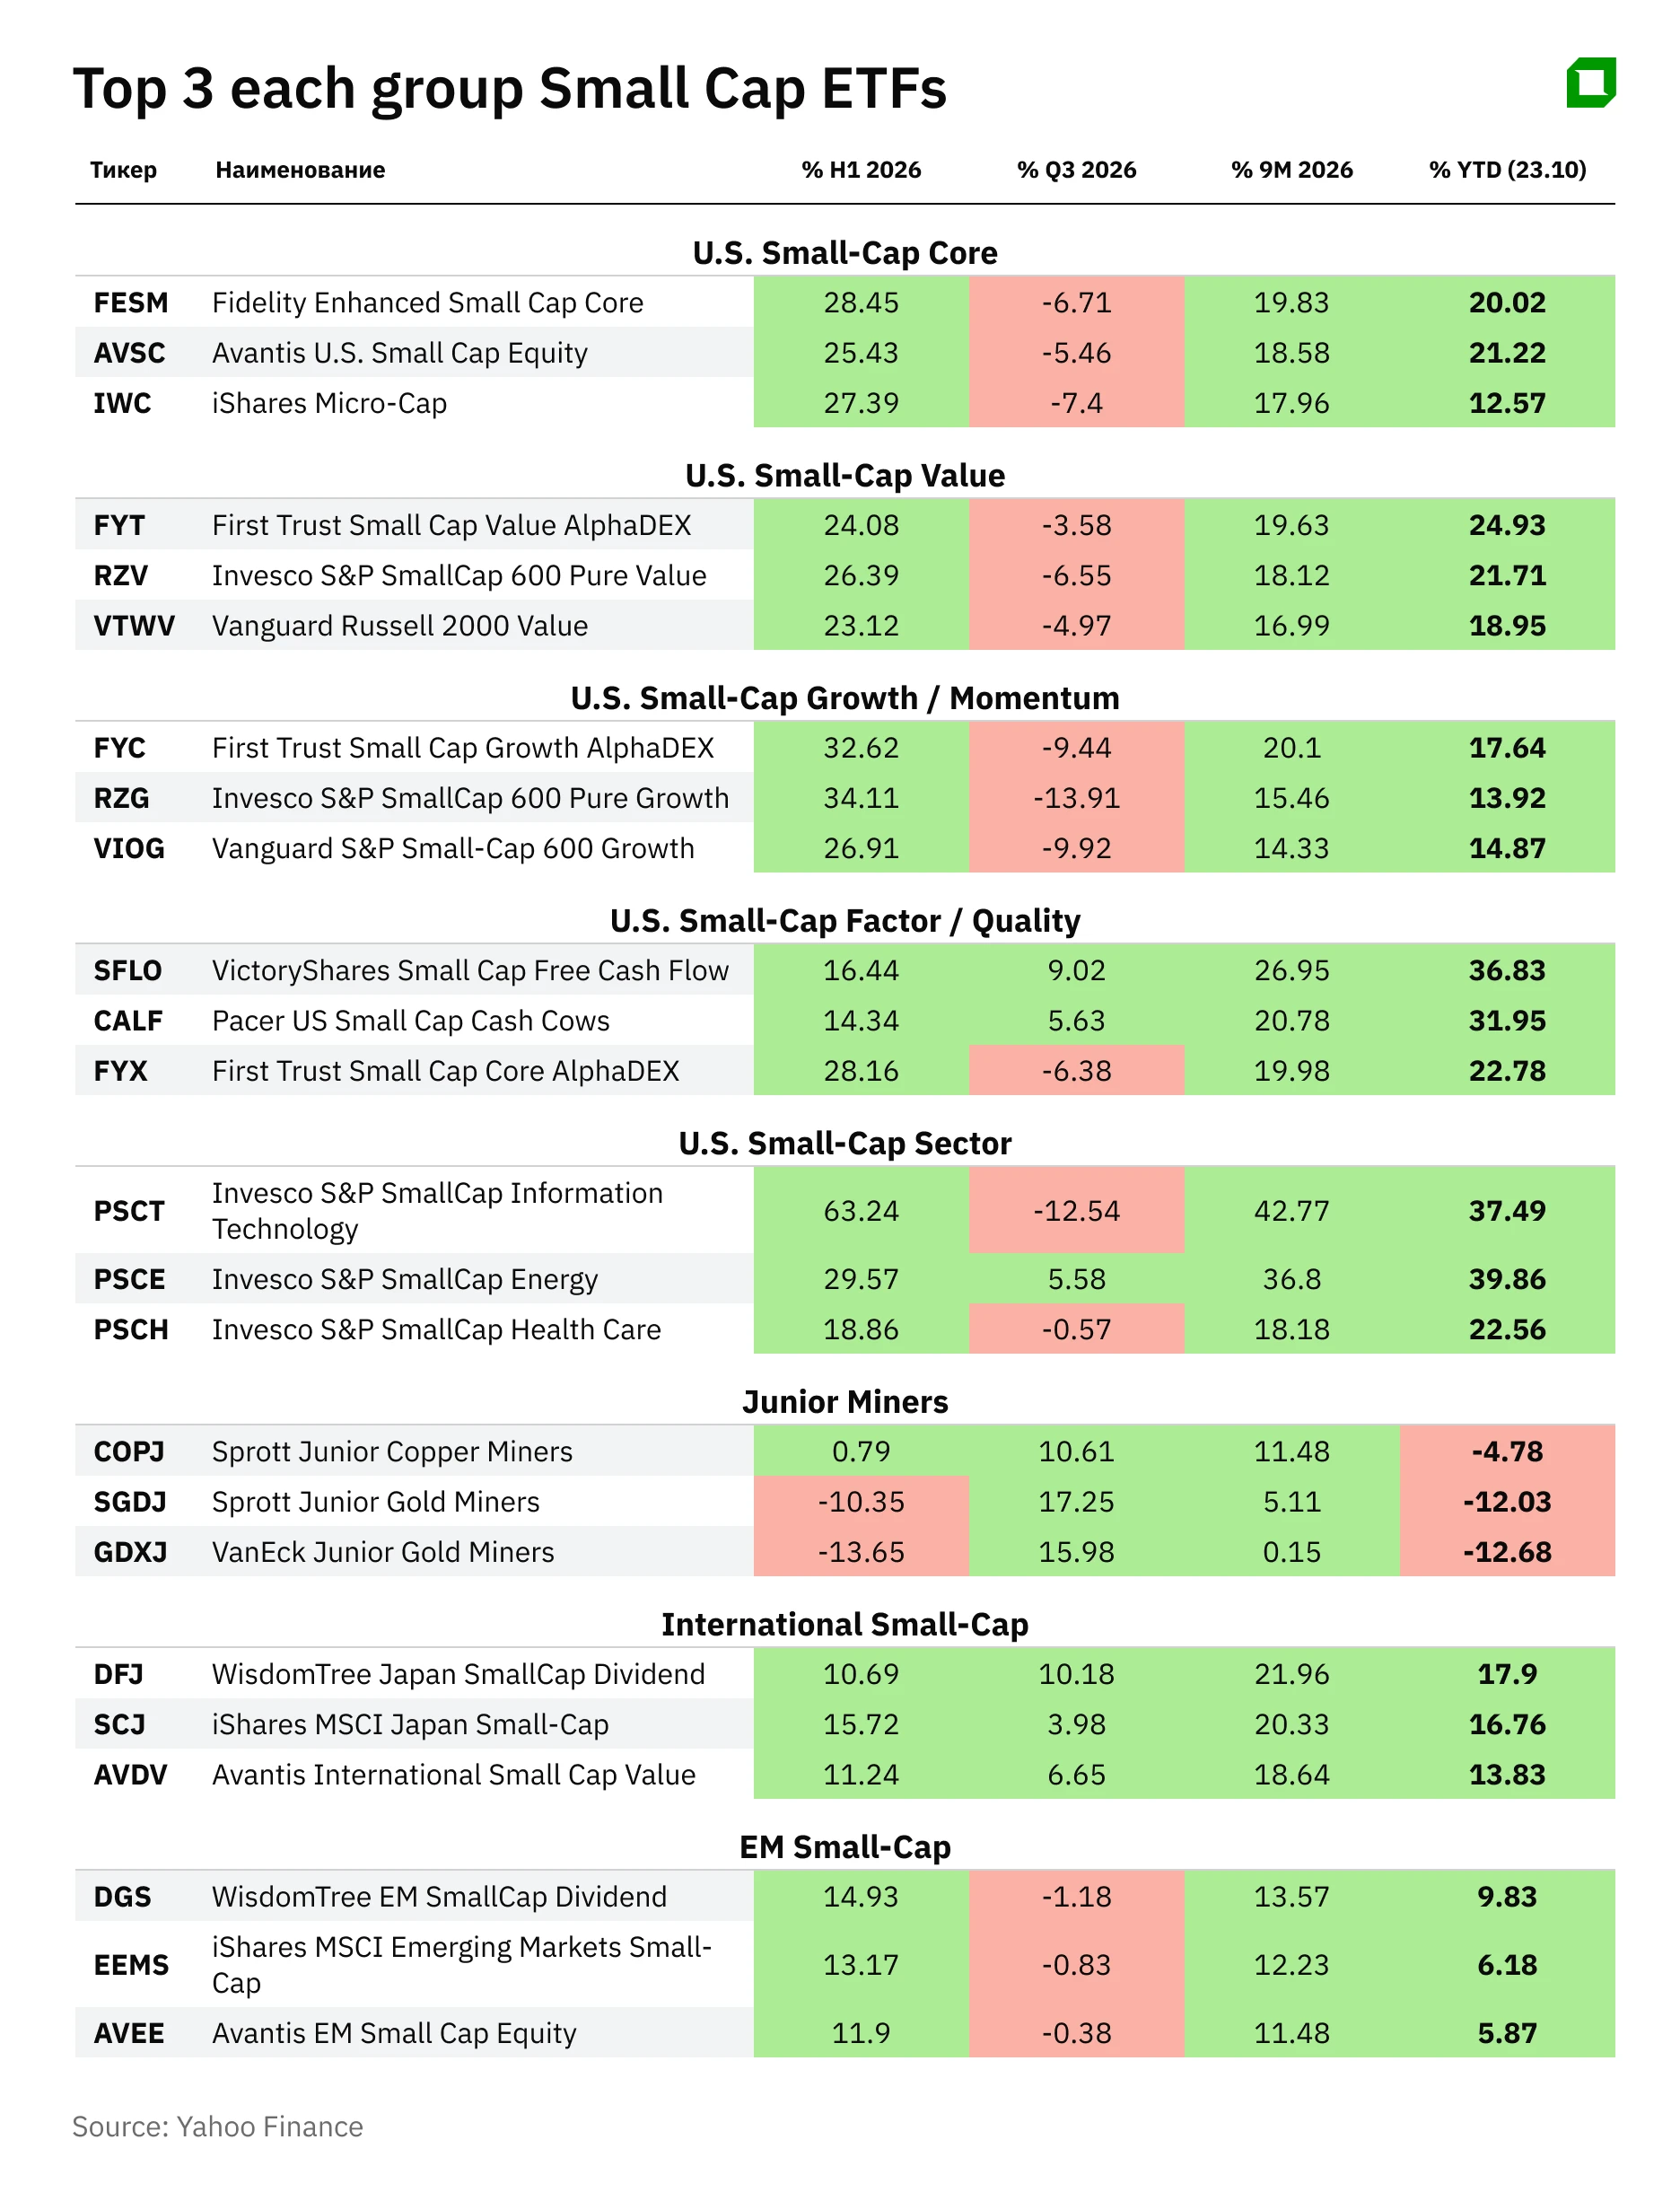
The Invesco S&P SmallCap Information Technology ETF posted the best performance since the start of the year, gaining 42.77%. Second place went to the Invesco S&P SmallCap Energy ETF, with a return of 36.8%. Third place went to the VictoryShares Small Cap Free Cash Flow ETF, which selects companies based on free cash flow—it rose 26.95%.
The third quarter saw a significant shake-up among the top performers: specifically, the Invesco S&P SmallCap Information Technology fund lost 12.54% during this period. Energy was the only sector in the Russell 2000 to post gains in the third quarter.
Among broad-market funds, the top performers year-to-date have been the First Trust Small Cap Growth AlphaDEX Fund (+20.1%), the First Trust Small Cap Core AlphaDEX Fund (+19.98%), and the Fidelity Enhanced Small Cap Core ETF (+19.83%). Over the past nine months, value stocks in the Russell 2000 have risen 17%, outperforming growth stocks, which gained 10.7%.
Funds tracking the S&P SmallCap 600 index have outperformed funds tracking the Russell 2000 index since the beginning of the year. However, in the third quarter, funds tracking the S&P SmallCap 600 lost about 8%—more than funds tracking the Russell 2000.
Japan and international value funds outperformed the U.S.
Among international funds, Japanese ETFs led the way over the nine-month period. In the third quarter, Japanese and international equity funds continued to rise amid a decline in U.S. small-cap stocks. The MSCI ACWI ex-USA Small Cap Index gained 2.1% for the quarter.
Emerging markets showed mixed performance: broad-market funds in the segment have risen since the start of the year, while Chinese and Indian ETFs remained in the red.
Funds tracking small-cap gold mining companies gained 16–17% over the quarter, but the VanEck Junior Gold Miners ETF barely broke even over the nine-month period. The Sprott Junior Uranium Miners ETF was the worst-performing fund in our sample since the beginning of the year.
What Lies Behind the Funds' Results
— Invesco S&P SmallCap Information Technology ETF
The fund tracks the S&P SmallCap 600 Capped Information Technology Index, which comprises technology companies from the S&P SmallCap 600 Index. According to Invesco, from the beginning of the year through September 30, the fund gained 42.7% in net asset value, while the S&P SmallCap 600 Index rose 14.08%.
The fund’s portfolio consists of 72 companies and is significantly more concentrated than that of broad-market funds: the ten largest holdings account for 28.5% of assets. As of October 26, the top holdings are satellite operator Viasat (4.2%), measurement equipment manufacturer Ralliant (3.41%), and EPAM Systems, a provider of IT services to corporate clients (3.22%).
The fund’s valuation is higher than that of the broader small-cap market. As of September 30, the portfolio’s P/E ratio was 30.4, while the forward P/E ratio was 19.2, with a return on equity of 6.5%. By comparison, the P/E ratio of the entire S&P SmallCap 600 index, according to State Street, is 17.2. Almost all of the fund’s gains occurred in the first half of the year: in the third quarter, it lost 12.5% as technology small-caps fell along with other growth stocks amid Fed rate hikes and rising bond yields.
— Invesco S&P SmallCap Energy ETF
The fund tracks the S&P SmallCap 600 Capped Energy Index, which includes energy companies from the S&P SmallCap 600, such as oil refiners and pipeline operators. According to Invesco, from the beginning of the year through September 30, the fund gained 36.7% in net asset value, compared with 14.1% for the S&P SmallCap 600 Index.
The fund is small and highly concentrated. As of October 23, its assets totaled approximately $103 million, and the portfolio includes 34 companies, with the ten largest accounting for about 48% of the assets. The largest holding is the oil producer SM Energy, with an 8.4% stake, followed by Magnolia Oil & Gas (5.4%) and the drilling rig operator Noble (5.4%).
As of September 30, the fund’s shares were trading at 12.5 times annual earnings—nearly 2.5 times cheaper than the Invesco S&P SmallCap Information Technology fund. In September, the fund distributed $0.41 per share, compared with $0.24 a year earlier.
— VictoryShares Small Cap Free Cash Flow ETF (SFLO)
The fund selects 300 small-cap companies with the highest free cash flow yield (the ratio of free cash flow to enterprise value), of which 200 securities with the best revenue and EBITDA growth metrics are included in the portfolio. The weight of any single company is capped at 4%, and the sector cap is 45%. During a period of rising interest rates, this approach filters out unprofitable companies that are most dependent on debt financing, which helped the fund grow in the third quarter. Net assets as of October 273 reached $835 million.
's portfolio is broadly diversified: its ten largest holdings account for only 13.2% of its assets. As of October 26, the top holdings are the insurance company Oscar Health (1.55%), the ride-hailing service Lyft (1.49%), the domain registrar GoDaddy (1.48%), and the social network Pinterest (1.47%).
The difference between the fund and the value index is clearly evident across sectors. As of September 30, the energy sector accounted for 18.7% of the portfolio, compared with 7.9% in the Russell 2000 Value Index, while the financial sector accounted for only 1.8%, compared with 28.4%. Real estate and utility companies, which are the most sensitive to interest rates, are not represented at all in the fund.
According to Victory Capital, as of September 30, the fund’s holdings were valued at 21 times annual earnings, compared with nearly 44 times for the Russell 2000 Value Index, and its return on equity was 14.6%, compared with 3%. The fund rose 9% amid rising interest rates and oil prices.
What Investors Can Expect
Pressure on small-cap stocks may continue, but valuation remains a strong case for the segment: According to Royce, small- and micro-cap value stocks remain the cheapest segments of the U.S. stock market.
In September, the inflow of funds into small-cap ETFs slowed. The key question for the fourth quarter is whether earnings growth at small companies will offset the rising cost of borrowing, or whether the rotation toward large-cap companies and international markets will continue.
*Fund returns are calculated with dividends reinvested; index returns are calculated without dividends, based on data from Yahoo Finance. Periods: Dec. 31, 2025–Sept. 30, 2026 and June 30, 2026–Sept. 30, 2026. Leveraged and inverse ETFs are not included in the ranking.
This is not intended as individual investment advice.